How Interest Rates Drive Productivity
How Interest Rates Drive Productivity
Much has been made over the past 15 months about the impact of rising rates. Rising interest rates portend an ominous environment for the holders of existing assets, particularly those asset holders that acquired (and therefore priced) investments during a period when interest rates were very low. As interest rates rise, the value of assets falls. The carnage associated with asset price declines is now obvious.
Now the question becomes – what is the impact on businesses of a higher for longer interest rate paradigm? Will businesses see higher or lower returns on invested capital (as defined as operating income over total debt and equity deployed in a company)? How can we test this question against historical data?
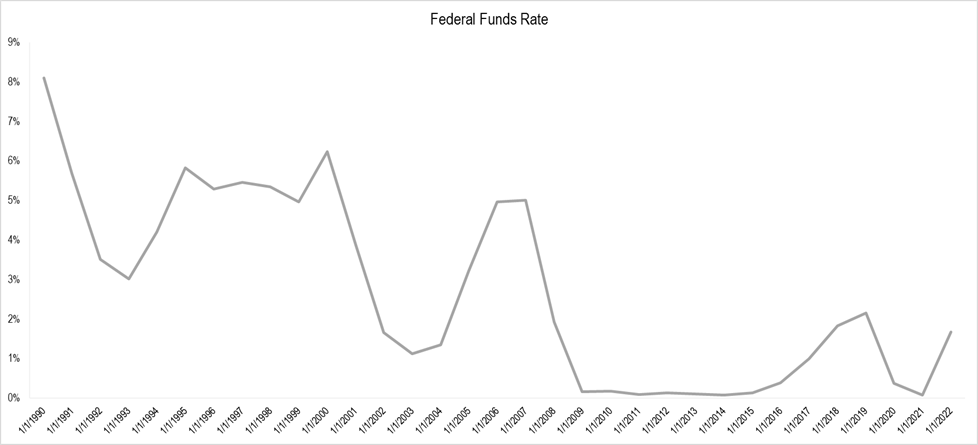
The challenge in answering this question is driven by the fact that interest rates have been near zero for almost 20 years, as shown in the graph above. The most recent period during which real interest rates were solidly positive was the 1990s. What insights can be drawn from comparing returns on invested capital in the 1990s relative to the 2000s and 2010s?
To conduct this analytical exercise, we ran a screen of the companies currently listed in the S&P 500. There are obvious issues with using this as the data set versus others in evaluating returns on invested capital for companies over time. We’ve listed these issues in the appendix for transparency.
The below chart illustrates the returns on invested capital of the S&P 500 companies over time, excluding seven large technology platforms – Apple, Microsoft, Amazon, Google, Facebook, Netflix, and Tesla. The impact of these seven companies on the metrics of the other 493 companies in the S&P 500 is so substantial that it made sense to exclude them. We’ll cover those findings in a follow-up article.
Removing the seven large technology platforms from the data, we observe a noticeable decline in the returns on invested capital of the screened companies over time. Throughout the 1990s – federal fund rates averaged 510bps – returns on invested capital for S&P 500 companies averaged 16.2%. This means that these companies generated $16.20 of operating income for every $100 of capital deployed. During the 2000-2007 interest rate paradigm – federal fund rates averaged 340bps – returns on invested capital declined to 15.6%. Companies generated $15.60 for every $100 of debt and equity deployed. This 4% decline in returns could have been driven by any number of exogenous factors beyond rates, but the association of the two is striking. The 2008-2019 data – federal fund rates averaged 70 bps – becomes even more interesting. Returns on invested capital declined 11% from the 1990s to 14.4%. This means that companies in the S&P 500 generated $14.40 of earnings for every $100 of capital deployed.
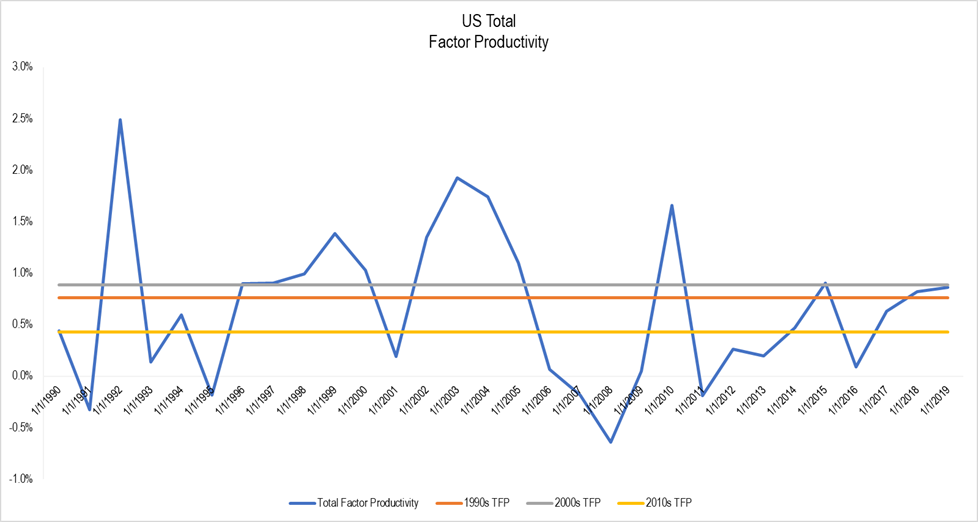
The declines in returns on invested capital also coincide with declines in total factor productivity (another indicative measure of business efficiency) observed in the broader economy. In the post-2008 period, with interest rates at or near zero, total factor productivity plunged by 44% relative to the 1990s. Total factor productivity is an important metric because it represents a key input into the gross domestic product equation. GDP is calculated as total capital deployed, multiplied by total factor productivity (the efficiency of the capital deployed), multiplied by the amount of available labor. Based on this data, it appears that as the US increased the amount of capital available in the economy by lowering interest rates, the requirement to productively deploy that capital declined.
Another interesting observation fell out of this screen of returns on invested capital for S&P 500 companies. From 2020-2022, governments around the world relaxed monetary policy considerably, which, coupled with fiscal stimulus, created one of the healthiest business operating environments in history. Returns on invested capital spiked in 2021 to levels not seen since the mid-1990s. This spike – driven by significant consumer and business liquidity provided by government stimulus – represents classic Keynesian economics. Governments possess varying degrees of capacity to stimulate economic activity, but only for short periods of time. At some point, businesses and consumers need to stand on their own by supporting themselves without significant government involvement. The past three years, including the significant market and profitability correction in 2022 and 2023 demonstrate the fragility of this approach.
As a result, businesses should not internalize the overearning or easy operating conditions experienced over the last three years. The monetary and fiscal policy paradigm of the last 20 years has been altered by macroeconomic and geopolitical conditions around the world. The world is likely entering a higher for longer interest rate environment. While this understandably causes consternation for asset holders, this should be cheered by businesses if historical results can be replicated. We reenter the age of business knife fights inside a phone booth, but the returns end up tremendously positive.
Prospectively, the austerity implemented by higher for longer interest rates will make businesses do more with less – likely driving returns on invested capital higher. This means operators building businesses should expect to accomplish more with less capital. This means less debt, lower equity dilution, and shorter periods of time to build successful businesses. That said, an entirely new playbook for operators will be required relative to that relied upon over the last 20 years. Likely gone are the days of excessive debt and equity-based growth strategies. There seems to be a clear correlation between lower cost of debt and equity capital and returns on invested capital. Business operators gravitated towards the lower cost capital option of external financing versus generating their investment capital internally. Prospectively, free cash flow will once again enter the broader business lexicon, as it will power the winners of the next decade given the cost of external funding will be substantially higher than the prevailing rate of the last 20 years.
It seems that rising rates represent a positive development for the operating environment of businesses. It also seems clear that operators that “do more with less” will win in a higher for longer interest rate paradigm. Those operators that embrace excess risk or abuse of capital will be punished as risk suddenly contains a cost. Businesses that embrace productivity, efficiency, and ruthless adherence to returns on capital thresholds will generate the “alpha” over the next decade. There’s no doubt, however, that a significant number of bad habits and practices need to be unlearned by business leaders. Those quick to do so will be the most successful leaders of the next decade.
Appendix
Caveats to the S&P 500 screen.
First, looking at the companies in the S&P 500 in 2023 obviously skews the data towards those companies that have been successful over the past 30 years. Second, the current S&P 500 companies are on many measures very mature, which will lead to declining returns on invested capital over time (assuming capitalism works). Third, the seven largest technology companies today (Apple, Facebook, Google, Amazon, Microsoft, Netflix, and Tesla) skew this data, as they’ve been wildly successful over the past 30 years. I’ll include some of that data in a follow-up, as they also drive interesting observations about the state of the markets and economy. Fourth, we’re not looking at equity market returns, but rather the operating income generated by the total debt and total equity retained inside the company. GAAP accounting jockeys might contest this metric for a variety of reasons, but it’s the most straight forward data point I could generate to evaluate the question. Fifth, the adoption of stock purchases to fund massive stock-based compensation plans also skews the data and tells an interesting story about the state of US business. Sixth, there are myriad of thousands of other exogenous inputs that could impact this data, but we’re going to suspend frictions and evaluate only interest rates and returns on invested capital in this exercise. Seventh, this data comes from automatic formulas provided by CapitalIQ.
—
Alexander Stacy
View the original article here.


