
Sticky Situation

In this article we’ll explore the “Sticky Situation” we find ourselves in financially and economically. Decades of easy money met the COVID crisis, knocking the US and global economy off its goldilocks relationship with low interest rates, low inflation, and low growth. The response to the COVID driven crisis created excesses in the financial and economic system that will likely manifest themselves over the coming months and years. The following is a series of data and commentary that will ideally provide a bit of context to our current predicament. We’ll try to draw some preliminary conclusions towards the end. Hopefully you’re still with me 😊.
M2 Growth
M2 consists of savings deposits, balances in brokerage accounts, and money market funds. This is basically cash in the system awaiting deployment into spending or investable assets. Gold bugs believe this chart should track the supply of gold over time. Bitcoin maximalists believe the supply of money should be virtually constant over time — with its value determined by economic activity. Modern monetary disciples believe this can be a sustainably growing balance over time. Regardless of the side of the fence you’re on, we lost the plot during COVID with M2 up nearly 50% during that time.

Federal spending
The government in most countries represents a very large percentage of GDP — in the US it has been reasonably steady at 20% of GDP (federally). This means that 20% of annual business profit in the economy comes from the government. When a government spends money, it always crowds out private spending (either consumption or investment). This “crowding” concept is why government occupying too much of GDP is bad — it atrophies private enterprise and makes economies less market based (see Soviet Union collapse). During COVID, we increased government’s role in the US economy by >50% overnight — this led to an incredible amount of private demand destruction.

Labor participation rate
COVID created a dual headwind for the labor market: disincentivizing work through regular stimulus checks and personal safety fears driven by the virus. The confluence of these two factors created the largest drop in labor participation in our post-WWII history. Unfortunately, this isn’t a new trend, but one that has been ongoing for nearly three decades. A number of factors contribute to this decline in labor participation.

Inflation
The most oft cited measure of inflation is the consumer price index (CPI), published by the Bureau of Labor Statistics. This index is deeply flawed as a measure of inflation because it is regularly manipulated by government administrators to fit their desires (the ability to print money regularly). Even published statistics are quite concerning. The combination of increased M2, higher government spending, and lower labor participation led to higher costs for goods and services. Those three factors, combined with regulatory responses (shutdowns) to COVID, contributed to significant supply chain issues in most goods, contributing to the below reading.
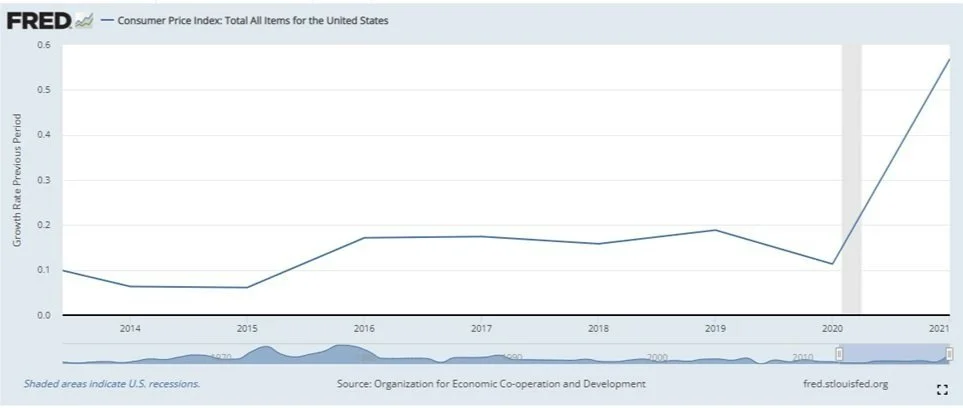
For those curious as to why CPI isn’t a valid measure of inflation over time, please go to the BLS website and read more about its formulation (https://www.bls.gov/cpi/questions-and-answers.htm).
Housing prices
Housing prices may actually serve as one of the best indicators of inflation — because you can’t really manipulate this data. We saw a 21% increase in the cost of homes from Q2 2020 to Q4 2021. This data doesn’t include Q1 2022, which saw prices continue to increase according to various data sets. As we know, the real estate asset class is highly levered, so these price increases represent magnified gains in equity value for Americans that own homes. This increase in prices is over a 1.5 year period. It’s important to understand that increases in house prices doesn’t rise all boats. Real estate price increases positively impact those long the housing market and negatively impact those short the housing market (you are long or short based on your asset allocation to real estate). It’s also important to understand that this asset class isn’t productive, and therefore this price increase is actually a transfer not an increase in wealth. Who did we transfer wealth from? Our youngest generations (see below). For context, prices for Miami properties have increased 6% per year for 100 years…. Is that a feature or bug of the market? These price increases likely represent a feature of the inflationary monetary system we’ve constructed.


One of the primary contributors to the increase in housing prices we are experiencing is the lack of supply. For a variety of reasons, the US structurally underbuilt new homes and apartments, while the number of households increased. Below is total housing and total households indexed since January 1, 2008.

Fed balance sheet
Balance sheet activities form one of the core tools of the Federal Reserve’s efforts to stimulate economic activity. The increase in assets on the Fed balance sheet is achieved by creating cash at the Fed and crediting a financial institution with an asset in exchange. The Fed increases its balance sheet through a dollar-for-dollar transfer of cash into the financial system. Modest increases in the Fed balance sheet have achieved great impact over time as this increase in cash at financial institutions is deployed into productive assets through debt or equity. The increase in liquidity in financial assets brings down the financial system’s overall cost of capital, which provides positive benefits by unlocking projects, like space travel, potentially deemed too expensive to warrant investment in higher cost environments. The dramatic increase in cash that occurred as a result of government response to COVID departed from historical practice by introducing previously unimaginable amounts of liquidity into the system virtually overnight.

The Fed’s desire to increase liquidity in the system drove an increase in the amount of treasuries on the Fed balance sheet. The Fed quickly became the largest holder of outstanding US treasuries — owning 26% of all treasuries, up from <10% prior to COVID. Buying treasuries increases liquidity within the financial system — easing blockages in credit markets we started to observe in 2020. At the same time, the Fed reduces long-dated treasury rates by impacting the supply and demand at different maturities — thereby impacting the risk free (and therefore risk-on) borrowing rates for all credit securities. Conveniently, the Fed’s purchases of treasuries provide capital to the US Treasury Department tasked with funding expansive fiscal stimulus programs authorized by Congress. Overall, the Fed’s buying distorts financial market conditions and mutes price signals traditionally embedded inside financial markets. Fundamentals don’t drive asset prices, liquidity does.

Moral Hazard
To combat the large scale defaults (and corresponding crisis in confidence) experienced in the US housing mortgage market during the Great Financial Crisis (GFC), the Fed began building mortgage backed securities (MBS). During the GFC, the Fed took >$1 trillion of MBS off private or semi-private enterprise balance sheets and allowed these securities to run off. In buying MBS from private actors, the Fed directly transferred the cost of defaults from specific actors in the system to the system as a whole. The Fed effectively nationalized downside risk in the housing market, creating an important precedent of moral hazard and one that carries implications to our financial system today. Moral hazard is created when market participants don’t experience the negative ramifications (default) of their actions. The Fed effectively nationalized risky behavior in the economy. Most people in the US were comfortable with this nationalization of risk to avoid a global collapse of the fractional banking system — one always at risk of “runs” on its institutions. Consistent increases in the Fed balance sheet reduces the cost of failure for society as a whole for a period of time. But, it’s important to understand that this doesn’t prevent failure it merely delays the ultimate reckoning. At some point, we will suffer the consequences of unwinding 15 years of bad behavior.

Money everywhere
Given the Fed’s policies of low rates and increasing balance sheets discussed above, money went everywhere for over a decade, but particularly accelerated as a result of the response to COVID.
Crypto


ETFs

Bonds

Stocks

Financial conditions
Something changed in November 2021. Financial conditions became quite a bit tighter as a result of a pivot in messaging from the Fed who recognized that inflation was not “transitory” and needed to react to mitigate inflation expectations from adjusting upwards. As we’ve just discussed, liquidity drives asset prices, not fundamentals and the Fed drove substantial increases in liquidity in the system intentionally during COVID. What happens when the liquidity stops flowing? You can see below the rate of change in Fed assets turned negative in November 2021. Reductions in liquidity in November 2021 set off a rippling of asset price declines we’re still encountering.

One of the best indicators of high risk assets is the Bessemer Cloud Index of “emerging” and established publicly traded SaaS companies. The index peaked on November 11, 2021.

Federal government capacity


Currently, the US federal government possesses very little capacity to intervene in the financial system. The Fed provided a backstop — moral hazard included — for global financial markets for 15 years. The Fed possessed this capability because previous crises started after periods of relatively high rates and reasonable government debt to GDP levels. The response to the GFC, various attempts during the 2010s to encourage economic growth, and the response to COVID reduced the Fed’s ability to respond to crises. These actions gave way to runaway inflation and low unemployment. With rates at 1% and CPI at 10%, the Fed can not reduce rates to respond to a crisis as it will violate its dual mandate. The US economy is stuck. No help from the Fed awaits.
Structural issues


Structural issues
Consumption v. Production
In the US, we’ve been overly focused on the consumer. Every crisis is a crisis of the consumer, how do we stimulate more spending from the US consumer. For good reason as 70% of the US economy rests on consumer spending. Three other components of spending and investment also comprise GDP — government spending, business investment, and net exports of goods and services. Consumption and government spending are easy categories to stimulate because they respond acutely to fiscal stimulus funded by increases in debt. Business investment and net exports respond less promptly to fiscal stimulus. Business investment requires societal buy-in, the likes of which we’ve seen in China, to invest in industries of both the future and the past (industries of the past tend to be “dirtier” than industries of the future). Net exports require a ruthless focus on competition as the global market will only clear those goods and services that excel above the competition.
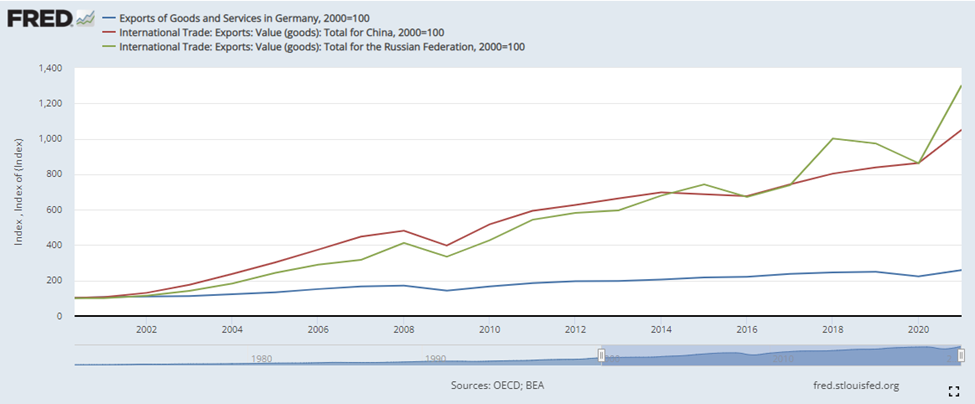
The below chart shows the startling impact of COVID restrictions on US net exports. The US effectively slowed output for two years while buying goods and services from other countries that continued working.
The US produces less than it did in 2007. The US only produces 5% more manufactured products in 2022 than it did in 2000.

By comparison, China increased its industrial production output by 6.5x from 2003 to 2020.

Energy

In an effort to advance consumption of renewable energy sources to combat climate change, emphasis on fossil fuel investment declined. Over the last decade, global exploration and production capital expenditures have declined globally by nearly 50% mostly driven by a US decline ~65%.
Declines in the long-term investment process of fossil fuels is driving a mismatch between global supply and demand of energy. JP Morgan expects shortfalls in supply of energy from all sources — renewable and non-renewable — over the coming decade.

Too much demand against too little supply leads to increases in prices. The below index of global energy costs demonstrates the current price spike. Unfortunately, after over a decade of underinvestment, supply will not respond to alleviate price increases for many years.
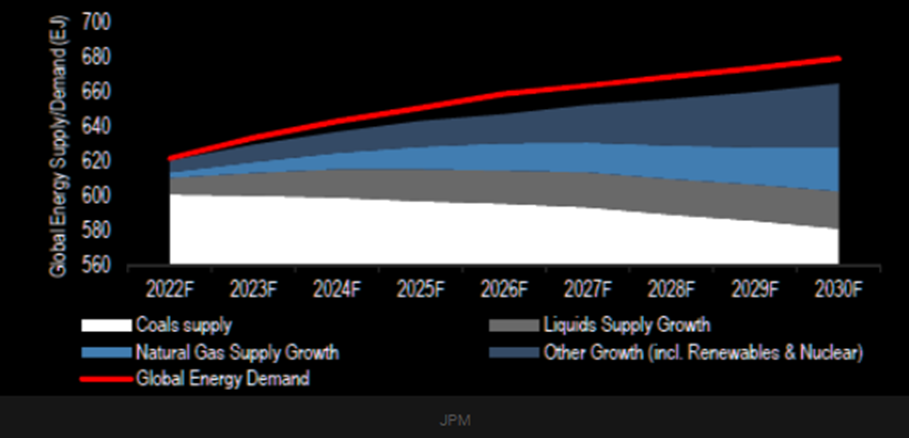
Too much demand against too little supply leads to increases in prices. The below index of global energy costs demonstrates the current price spike. Unfortunately, after over a decade of underinvestment, supply will not respond to alleviate price increases for many years.

Global imbalances
While the US consumer drives enormous net export balances.
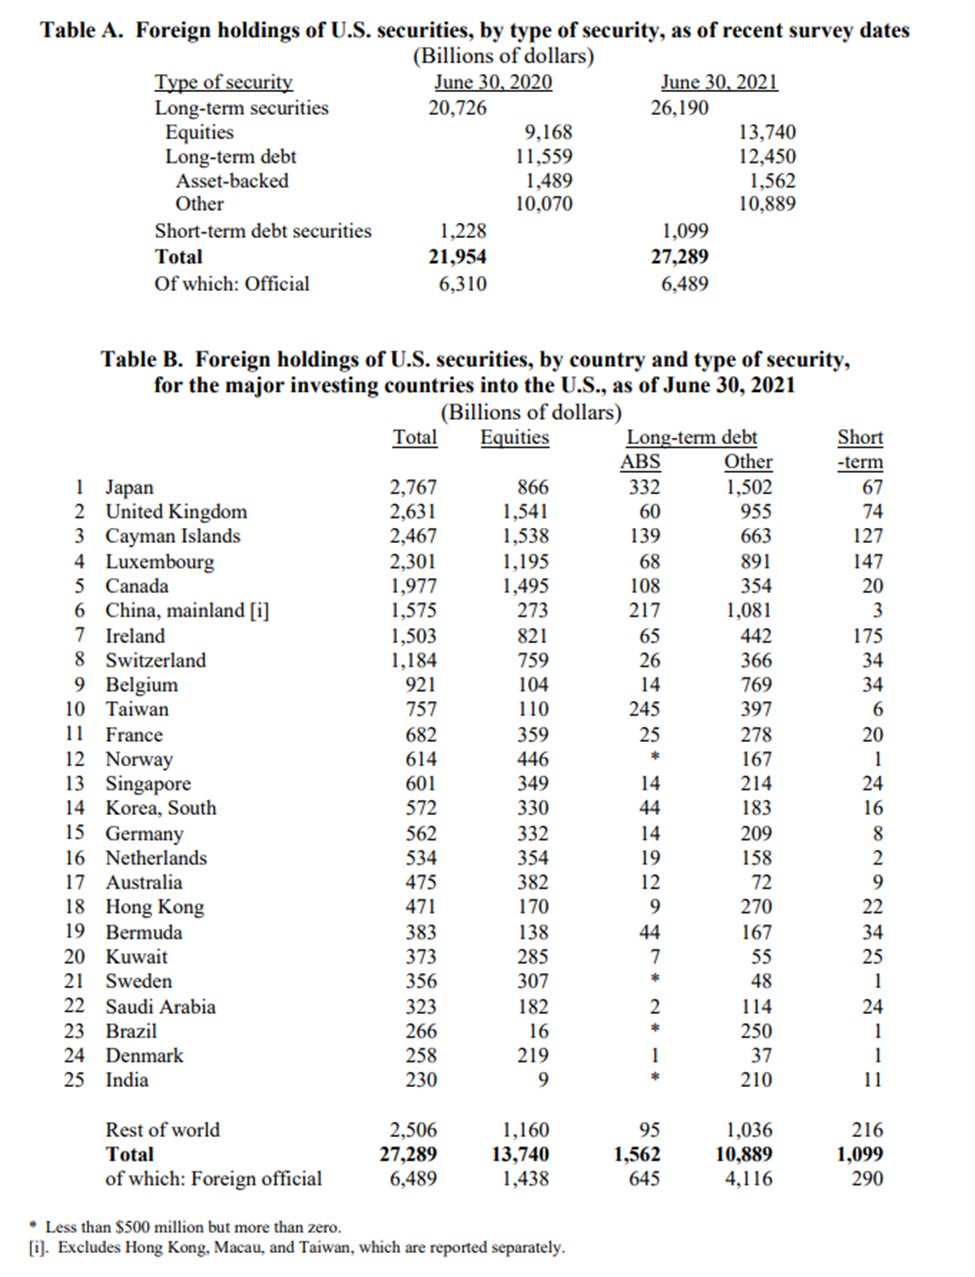
These imbalances drive a global reliance on US dollar assets — held in exchange for exports to the US. The reliance on US dollars to facilitate the global system of imbalance created and reinforces the system of US dollar hegemony.

Demand for US assets, driven by global trade imbalances drove strange things — like Switzerland deflating its currency to acquire US technology stocks.
Asset Prices

The liquidity introduced as a feature of the Federal Reserve and US consumer system drove high levels of competition for US assets. Higher demand than supply increases the cost of market goods. This surge in liquidity drove a bubble in everything from stocks, to bonds, to houses, to commodities. The below is the change in wealth observed across the US economy. The below chart shows a 40% increase in household wealth during COVID or $40 trillion. The US reached $40 trillion of total wealth in 1999–223 years to get to $40 trillion and 2 years to add $40 trillion.
The below chart “adjusts” for inflation, but I’ll remind you that CPI is an unreliable metric to truly judge inflation, so the deviation from the exponential growth curve is likely less severe. That said, the departure is likely still dramatic.

Conclusion

The combination of extended balance sheet, extended deficits, low interest rates, supply chain issues, and high inflation means the Fed backstop that has realistically existed since the 1980s is gone. The Fed only has two tools — interest rates and balance sheet activities. The “third” tool is just guiding expectations of rates and balance sheet activities. With US unemployment low and inflation high, the Fed need to use both tools (rates and BS) to attack inflation. Attacking inflation by reducing the balance sheet reduces liquidity in the financial system, which impacts prices. Raising rates also reduces liquidity by tightening conditions through impacts to the fractional banking system. Increasing rates also ends the 30 year bull run on bonds, because higher yields mean prices fall on the bonds held by investors.
Unfortunately, the Fed will struggle to impact rising prices through these measures. Fed measures result in demand destruction, but do not impact supply. If anything, increases in rates destroy demand for business investment. As you can see in the below chart (shaded green as areas of CPI inflating at >20%), the categories experiencing the highest inflation rely on industries with decades long investment cycles. Semiconductors, cars, oil and gas, and utilities underpin all economic activity and unfortunately need consistent investment to maintain healthy supply. All of this makes the task of the Fed a difficult to borderline impossible one.
The Fed’s abrupt departure from financial markets after 15 years of active participation caused significant damage to the functioning of markets — starting in November 2021. Without the Fed, our global system’s balance becomes challenged, for reasons outlined above. We could be headed for a much broader reset, delayed for decades by government intervention. Or, we could be headed for another delay of the inevitable through continued Fed intervention. The ultimate solutions to the current predicament are complicated and likely require substantial pain in the short term. The solutions will be painful particularly because they will require a significant departure from the status quo — a scary proposition. So scary that the Fed will likely defer the inevitable reckoning. As always, whenever we do decide to take our medicine, the we will emerge stronger and better than ever.

—
Alexander Stacy
View the original article here.